Original Dataset
Below is the original dataset used for this analysis. It includes product information such as brand, category, price, and rating.
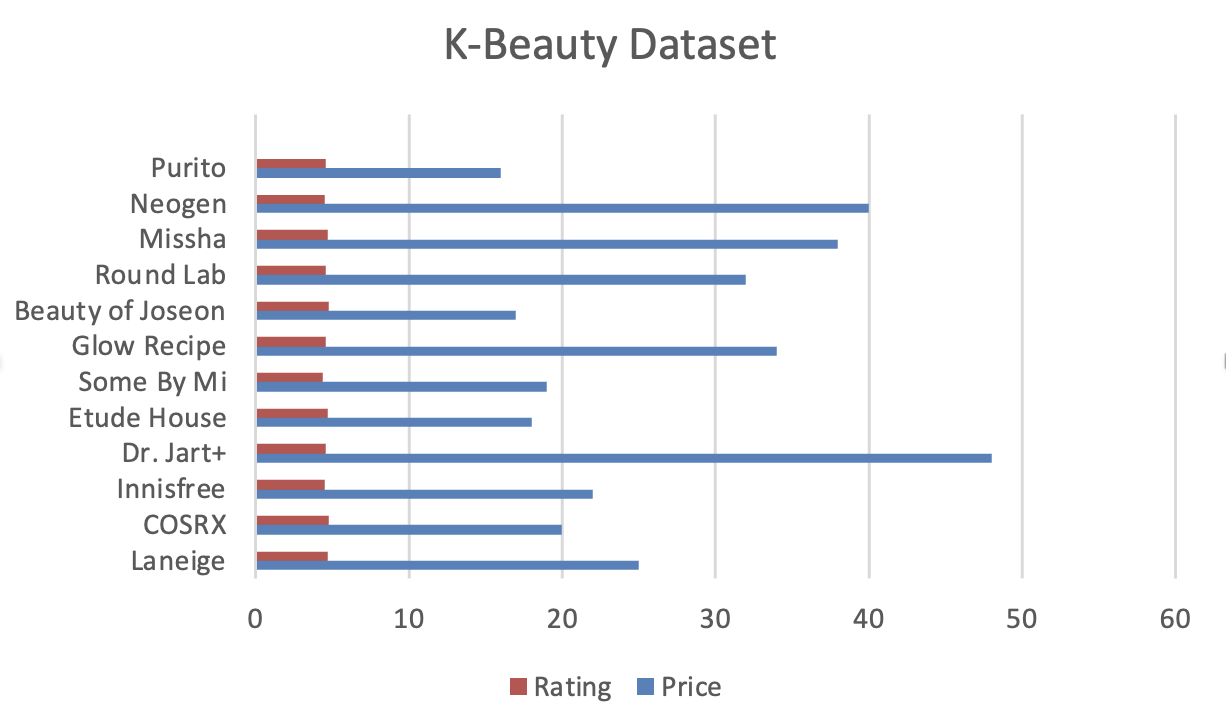
Chart 1 — Category Distribution
This chart shows how products in the dataset are distributed across major skincare concerns.
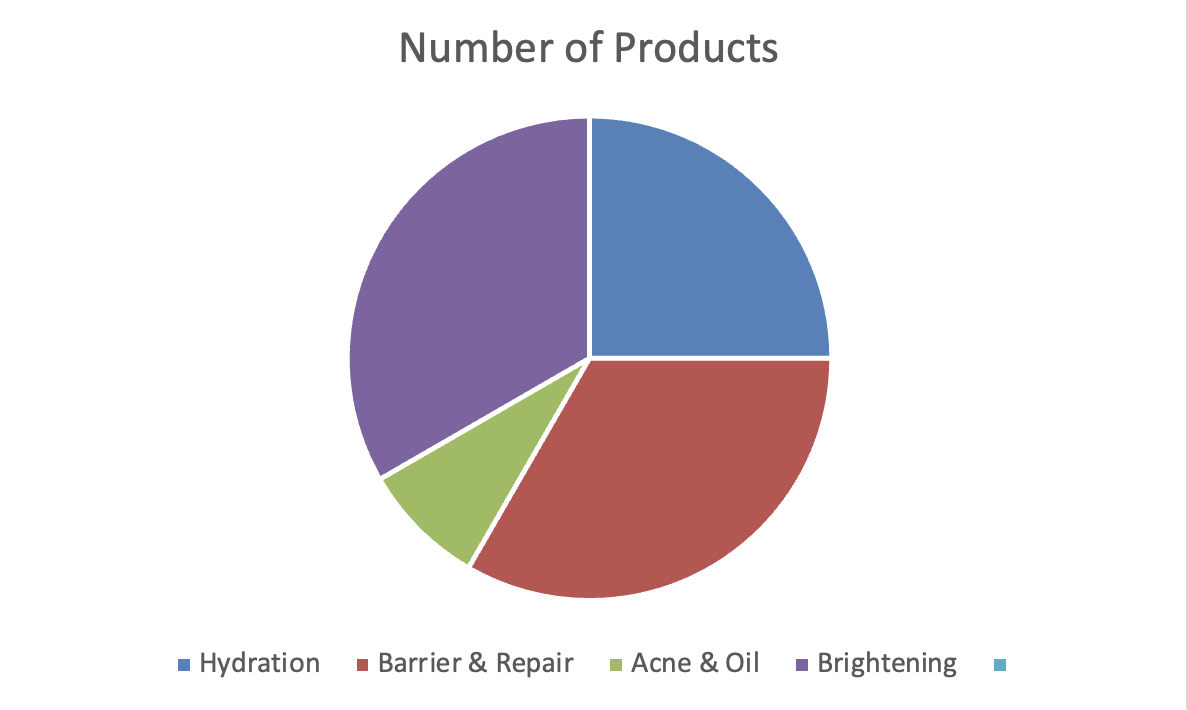
The pie chart reveals which skincare concerns are most heavily represented in the dataset. A stronger concentration in categories like hydration or barrier repair suggests that K-beauty often emphasizes skin maintenance and long-term skin health rather than only corrective treatment.
Chart 2 — Average Price by Category
This chart compares the average price of products in each category.
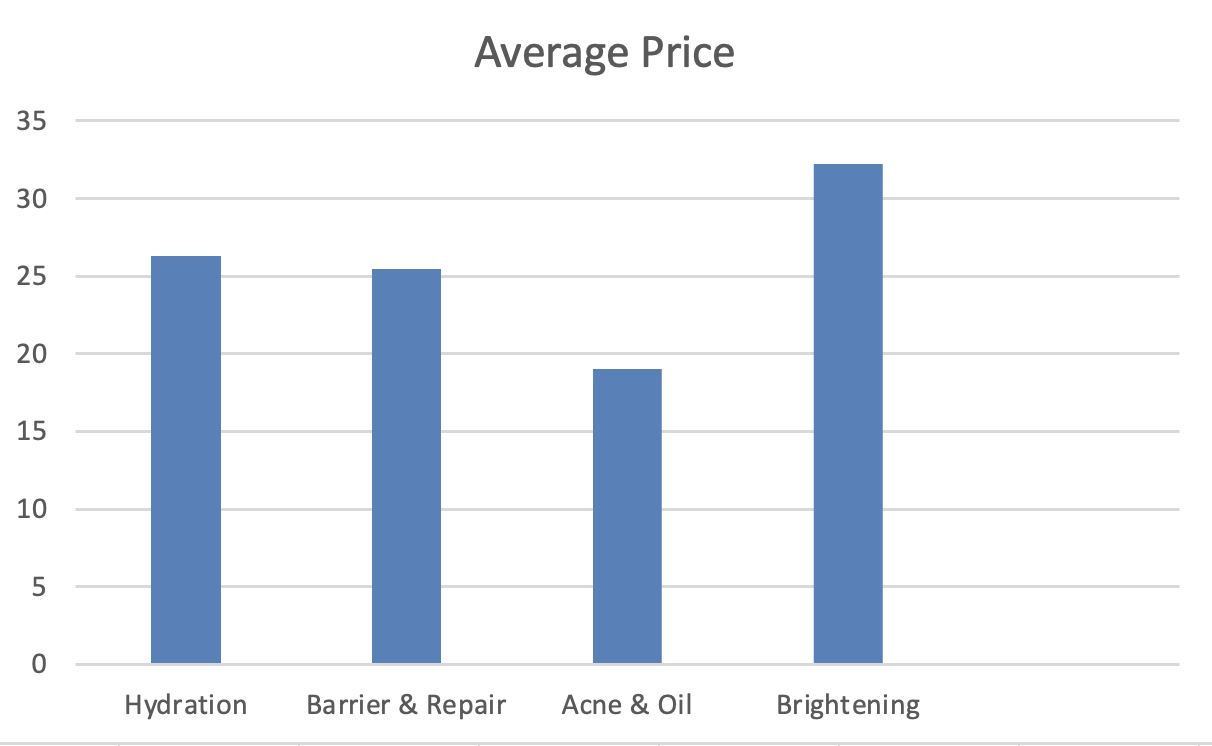
This bar chart makes it easier to compare how pricing changes across different product categories. Some categories appear to carry higher average prices, which may reflect differences in ingredients, branding, or the way certain skin concerns are positioned in the market.
Chart 3 — Price vs Rating
This chart looks at whether higher-priced products also receive stronger ratings.
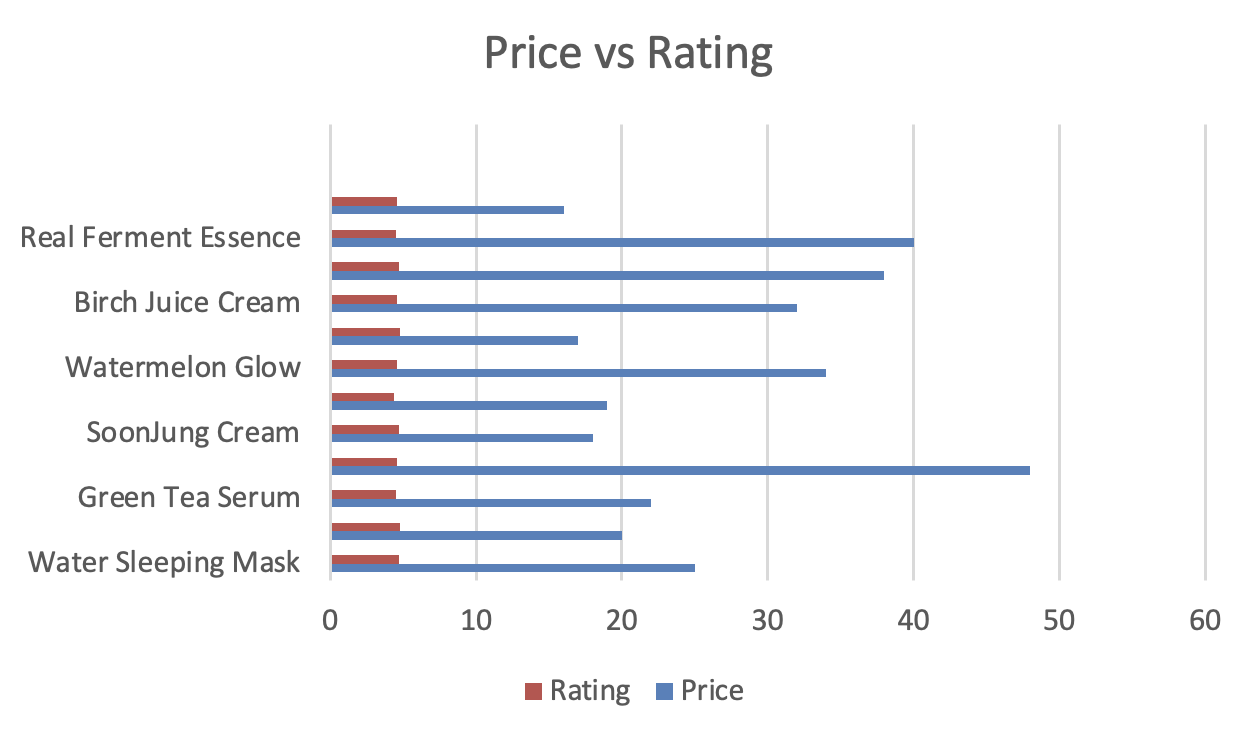
The relationship between price and rating is not perfectly linear. While some expensive products are highly rated, others perform similarly to lower-cost options, suggesting that value in K-beauty is not determined by price alone.